Transfer Function Measurement (TRF)
Features and Benefits
- Combines linear and nonlinear measurements
- Measures linear transfer function and harmonic distortions simultaneously
- Fast two channel data acquisition (< 88 kHz) with noise floor monitoring
- Highly adjustable stimulus (bandwidth, spectrum, crest factor)
- Provides impulse response and energy-time curve (ETC)
- Quasi-anechoic measurement due to windowing of impulse response
- Calculates time delay, minimal phase and group delay
- Provides cumulative spectral decay (CSD) and spectrogram
- Overlay of up to 20 result curves
- Detection of low energy, impulsive disturbances (clicks, Rub & Buzz, etc.)
- 3D representation reveals location and physical cause of Rub and Buzz
- Applicable to speakers and electronics
- Separation from ambient noise
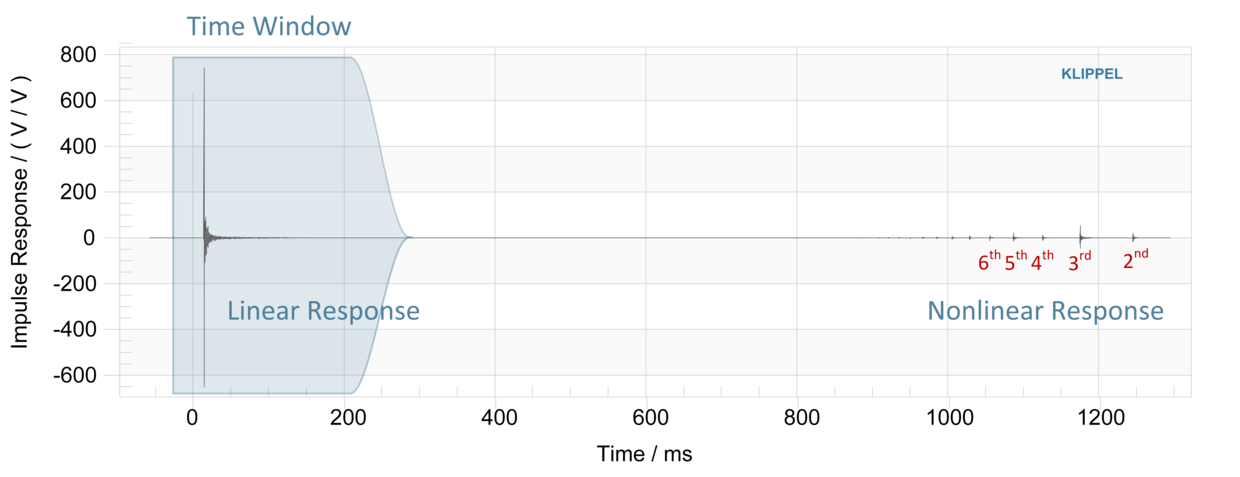
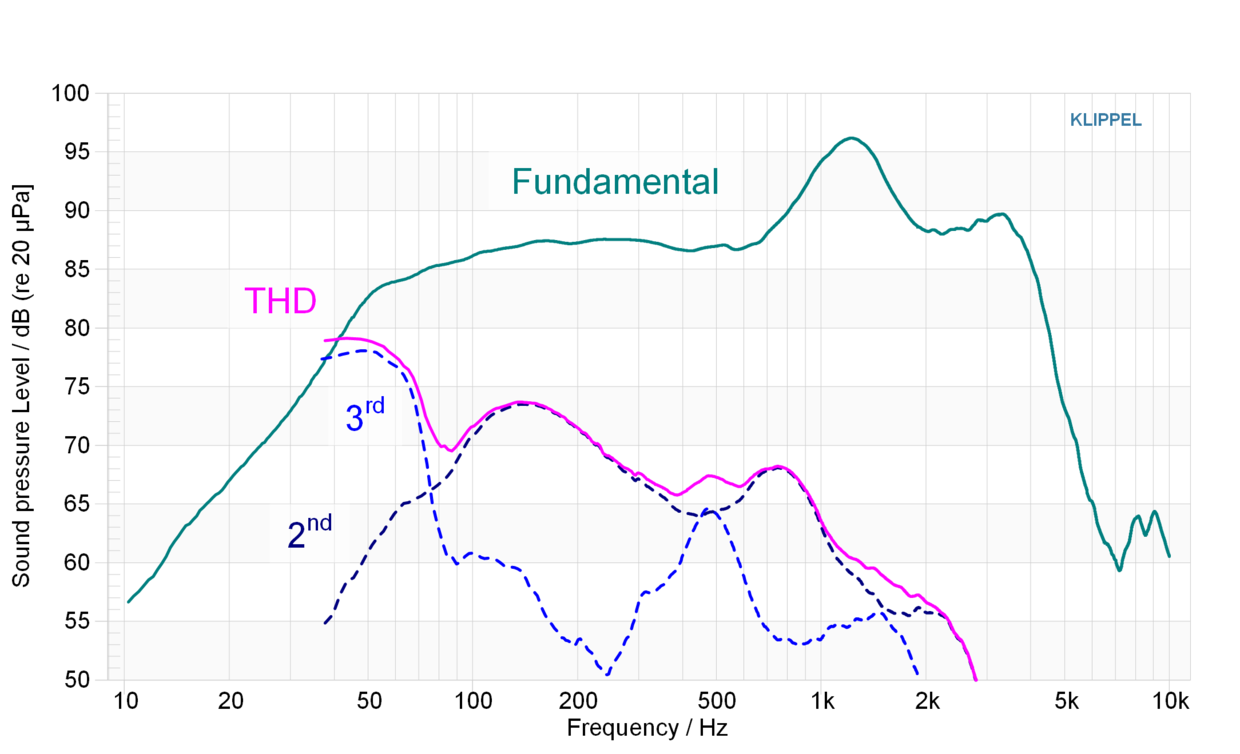
The TRF module measures two signals simultaneously and determines the magnitude and phase of the linear transfer function as well as the harmonic distortion at the same time. The stimulus is a logarithmic sweep with adjustable spectrum, bandwidth and crest factor. Window techniques (gating) applied to the impulse response allow a separation of the direct sound from early reflections, diffuse field and nonlinear artifacts.
Finally, post-processing provides the time delay (zero delay plane), minimal phase, group delay and several frequency-time transformations (e.g. cumulative spectral decay and spectrogram). A new measurement technique is provided for detecting low energy, impulsive disturbances, such as clicks and Rub & Buzz effects.
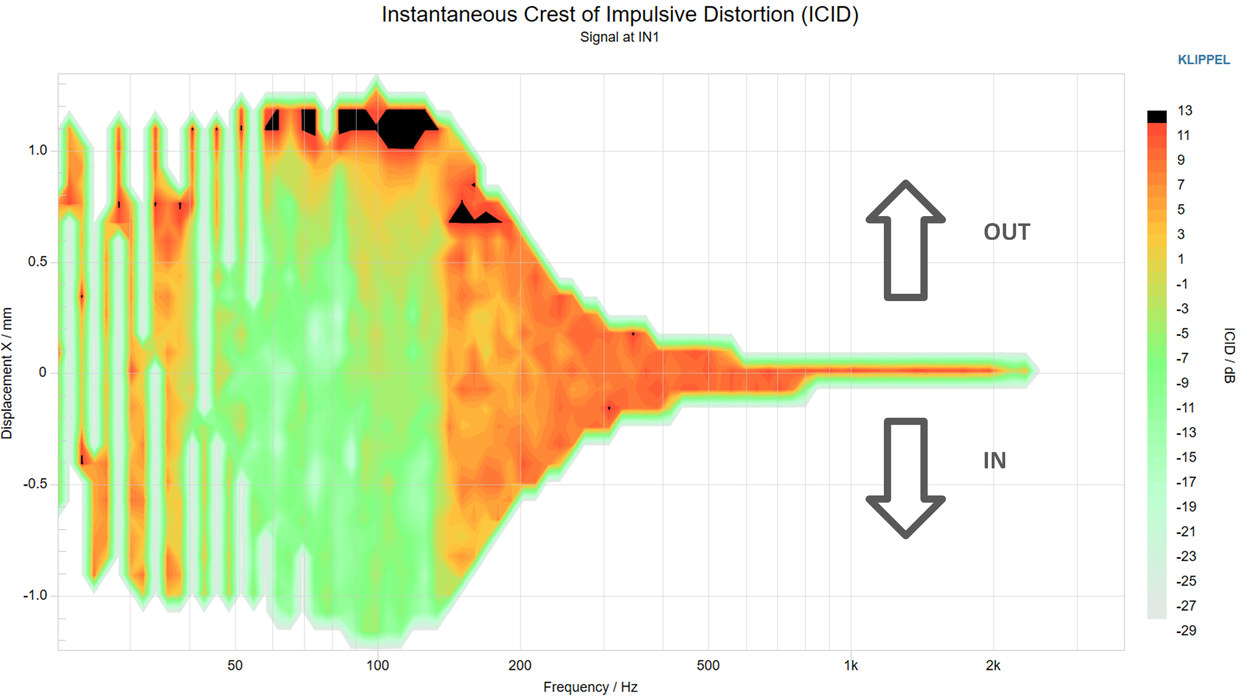
It reveals distortion of a much lower level and with a considerably higher temporal resolution (“instantaneous distortion”) than the traditional Fourier analysis, which shows mean values only. In addition to the common 2D representation (distortion vs. frequency), the distortion can be visualized in a 3D plot. Here, the crest factor of the impulsive distortion is mapped vs. frequency and vs. one of the measured signals (voice coil displacement). This is quite useful to localize and identify the cause of the disturbance.
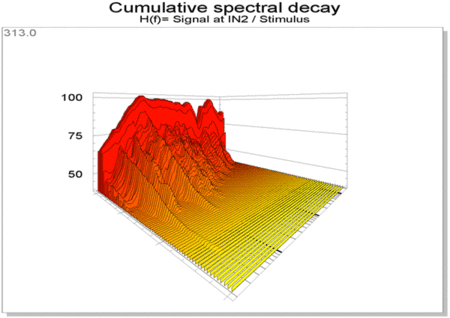
The figure shows the cumulative decay spectrum of a loudspeaker measured at 0.5 m in a normal living room by using the Transfer Function Module (TRF). The curve at time t=0 shows the steady state amplitude response which is dominated by the direct sound generating a smooth and flat response between 100 – 2000 Hz. The waterfall display shows the decaying energy of each sinusoidal component versus time after switching off the excitation signal at t=0. The direct sound decreases much faster than the energy of the room modes at discrete frequencies, which are fading much slower due to the low damping in the room.
The figure to the left illustrates the measurement of the equivalent input distortion using the TRF module. The harmonic distortion are measured at different points in the sound pressure field (left diagram) are transformed to the input of the loudspeaker system using the inverse transfer function H(f,ri)-1. This transformation shows that the harmonic distortion has a common source close to the input of the loudspeaker system, and the linear system response performs only a post-shaping of the distortion component. The measurement of the equivalent input distortion is a powerful concept to identify the physical cause of the distortion, to reduce redundancy of the measured data and to simplify the interpretation of the results.
Standard measurements
Impulse response
Magnitude and phase response
Harmonic distortion
Scanning mechanical vibration
Time-frequency analysis
Voltage and current
Electrical impedance
Voice coil displacement
DC displacement – dynamic offset the voice coil
Rub & Buzz and impulsive distortion
Air leakage noise
Far field sound pressure on-axis
Near field measurement
Directional radiation characteristics
Products
TRF Standard
is the universal (every-day) tool for electrical, mechanical and acoustical measurements.
TRF-Pro
provides the distortion analysis to localize loudspeaker defects, such as hard limiting, wire beat , voice coil rubbing, buzzing and loose particles.
Requirements
Test Hardware
PC
Software
Accessories
- Power amplifier
- KA3 Amplifier Card or
- 3rd party amplifier
- Microphone (optional)
- Laser (optional)
Application Notes
Templates
Operation and/or object templates for this module are available when creating a new operation or object in dB-Lab. This provides application specific setups and standard conforms tests.
Please find details on templates in Application Note AN 1001.
Related Information
Other Modules of R&D System
- Multi-Tone Measurement (MTON)
Module provides sound pressure level (SPL) based characteristics using a multi-tone stimulus
Related Products
- Hi-2 Weighted Harmonic Distortion (Hi-2)
Blat-Distortion - Meta Hearing Technology (MHT)
Defect detection beyond human hearing - Multi-Tone Distortion Task (MTD)
- Sound Pressure Task (SPL)
Measurement of frequency response, THD and Rub & Buzz - Sound Pressure and Impedance (SPL-IMP)
Combined measurement of acoustic and electric characteristics based on sine sweep chirp
Literature and Papers
Standards
Consumer Electronics Association
CEA-CEB19, CEA-803 R200X, CEA-2006-A, CEA-2019, CEA-2031
International Electrotechnical Commission
IEC 60268-1, IEC 60268-3, IEC 60268-4, IEC 60268-5, IEC 60268-7, IEC 60268-16, IEC 60268-21, IEC 60268-22, IEC 61094-5, IEC 61305-5, IEC 61842, IEC WD 63034
European Standards
BS EN 54-24, BS EN 50332
Audio Engineering Society
AES2, AES56, AES X223
Institute of Electrical and Electronics Engineers
IEEE 269, IEEE 1206, IEEE 1329, IEEE 1652
American National Standards Institute
ANSI S1.15-Part 1, ANSI S1.15-Part 2, ANSI S3.7, ANSI S3.22, ANSI S3.25, ANSI S12.42
International Telecommunication Union
ITU-R Recommendation BS. 775-2, ITU-R Recommendation BS. 1116, ITU-R Recommendation BS. 1534-1, ITU-T Recommendation P.79
International Organization for Standardization
ISO 4869-3
Telecommunications Industry Association
TIA-470, TIA-810, TIA-920
American Society for Testing and Materials
ASTM F2504-05
Patents
USA: 7,221,167B2


