Harmonic Distortion
Characteristics: | KLIPPEL R&D System | KLIPPEL QC System |
|---|---|---|
| Total harmonic distortion (THD, THD+N) | TRF, DIS, TBM | SPL, SPL-IMP |
| Nth-order component versus frequency and/or amplitude | TRF, DIS, TBM | SPL, SPL-IMP |
| Hi-2 distortion (weighted low order harmonics) | DIS | Hi-2 |
| Equivalent input distortion | TRF, DIS |
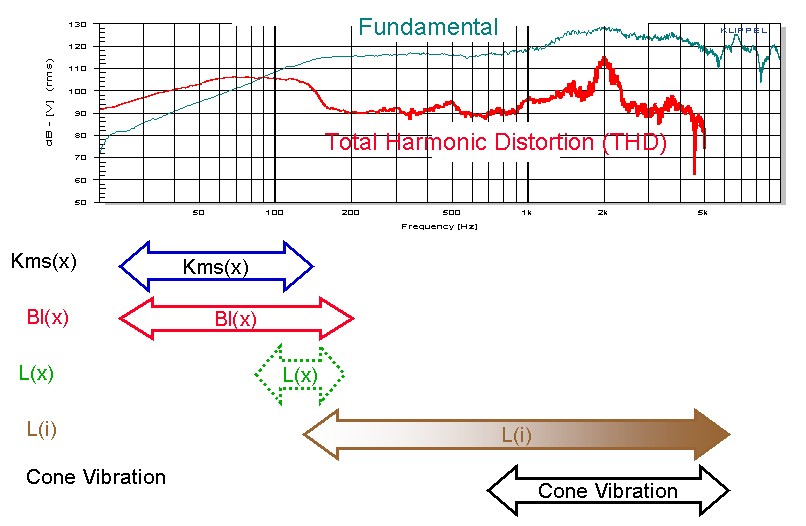
Harmonic distortion components found in the output spectrum indicate nonlinearities inherent in the device under test. However, the measured distortion values depend on the spectral properties of the stimulus. Therefore, harmonic distortion measurements only provide a special symptom but not a comprehensive description of the nonlinear system. Intermodulation and other distortion components may have a higher impact on sound quality. The interpretation of the results of harmonic distortion measurements can be simplified by considering the particular physics of the device under test and psycho-acoustical processing in human hearing (e.g. masking effect). Recent progress in the nonlinear modelling of loudspeakers and other transducers explains how the force factor Bl(x), stiffness Kms(x) and other nonlinearities contribute to the harmonic distortion responses. The figure below illustrates this for a woofer.
. The results ar")
The DIS module measures the harmonic distortion while changing frequency and amplitude of the excitation tone. The maximal value of the amplitude is determined automatically by the protection system provided by DIS (e.g. 10 % distortion value). The results are transferred to the mathematical post-processing tool (MAT) where the maximal SPL level for any percentage of THD (e.g. 1 %) is calculated.

The figure to th left illustrates the calculation of the equivalent input distortion as performed by the TRF module. The harmonic distortion found in the sound pressure signal depends on the receiving point r and the properties of the particular transfer path H(f,r). TRF performs an inverse filtering and compensates for the post-shaping by H(f,r) which gives identical values of equivalent input distortion. This is always the case for motor and suspension nonlinearities generating the distortion in the one-dimensional signal path close to the input.
KLIPPEL R&D SYSTEM (development)
Module | Comment |
|---|---|
TRF provides a fast harmonic distortion analysis (THD and higher-order distortion components) for all signals used for the transfer function measurement. | |
DIS module performs a steady-state distortion measurement with user-defined pre-excitation time. DIS stepwise increases the amplitude of the stimulus and protects the transducer under test if the voice coil temperature or distortion exceed user defined limits. | |
| Tone Burst Measurement (TBM) | TBM module runs band limited burst measurements versus input voltage and frequency. The results are evaluated in the frequency domain towards a threshold curve. |
KLIPPEL QC SYSTEM (end-of-line testing)
Module | Comment |
|---|---|
Sound Pressure and Impedance Task (SPL-IMP)
| The Tasks measures 2nd-5th harmonics and THD using a sinusoidal chirp with sweep speed and amplitude profile which excites the loudspeaker persistently in the critical frequency range while performing an ultra-short measurement. |
| Hi-2 Weighted Harmonic Distortion (Hi-2) | The Hi-2 Feature is based on specially weighted harmonics of 2nd to 10th order. It is mainly used in automotive industry for woofers and subwoofers. |
Example:
Templates of KLIPPEL products
Name of the Template | Application |
|---|---|
Diagnost. MIDRANGE Sp1 | Comprehensive testing of midrange drivers with a resonance 30 Hz < fs < 200 Hz using standard current sensor 1 |
Diagnost. RUB & BUZZ Sp2 | Batch of Rub & Buzz tests with increased voltage (applied to low power devices) |
Diagnost. RUB & BUZZ Sp2 | Batch of Rub & Buzz tests with increased voltage (applied to low power devices) |
Diagnost. SUBWOOFER (Sp1) | Comprehensive testing of subwoofers with a resonance 10 Hz < fs < 70 Hz using standard current sensor 1 |
Diagnostics MICROSPEAKER Sp2 | Comprehensive testing of microspeakers with a resonance 100 Hz < fs < 2 kHz using sensitive current sensor 2 |
Diagnostics TWEETER (Sp2) | Comprehensive testing of tweeters with a resonance 100 Hz < fs < 2 kHz using sensitive current sensor 2 |
Diagnostics VENTED BOX SP1 | Comprehensive testing of vented box systems using standard current sensor 1 |
Diagnostics WOOFER (Sp1) | Comprehensive testing of subwoofers with a resonance 30 Hz < fs < 200 Hz using standard current sensor 1 |
Diagnostics WOOFER Sp1,2 | Comprehensive testing of subwoofers with a resonance 30 Hz < fs < 200 Hz using current sensor 1 and 2 |
EIA 7.4 Distortion | Distortion measurement according EIA-426-B 7.4 Section B - Distortion |
Equivalent Input Dist. AN 20 | Equivalent input distortion according Application Note AN 20 |
Hi-2 Dist. Automotive AN 7 | Weighted harmonic distortion (blat distortion) used for Application Note AN 7 |
IEC 24.4 Harmonic Distortion | Characteristic harmonic distortion according IEC 60268-5 chapter 24.4 |
Max SPL Level THD at LIMIT | Maximal sound pressure level (SPL) for a given percentage of harmonic distortion (THD) |
Xmax10 % distortion | Maximal peak displacement producing 10 % distortion |
TRF Crest Harmonics (x,f) | Crest factor harmonic distortion versus displacement to find Rub & Buzz and other loudspeaker defects |
TRF Equiv. Input Harm. (SPL) | Equivalent harmonic input distortion calculated by inverse filtering of the measured distortion |
TRF Harmonics current (Sp1) | Harmonics of the current signal using standard sensor 1 |
TRF Peak harmonics, time domain | Peak value of higher-order harmonics in time domain for Rub & Buzz analysis |
TRF rubb+buzz w/o Golden Unit | Rub & Buzz detection without "Golden Unit" according Application Note AN 22 |
TRF rubb+buzz with Golden Unit | Rub & Buzz detection with "Golden Unit" according Application Note AN 23 |
TRF SPL + harmonics | Standard measurement for fundamental component (SPL) and harmonic distortion |
DIS 3D Harmonics AN 9 | Harmonic distortions versus frequency and voltage according Application Note AN 9 |
DIS Harmonics vs. Voltage | Harmonic distortion measurement versus amplitude |
DIS Hi-2 | Weighted harmonic distortion (blat distortion) used for Application Note AN 7 |
| QC SPL Hi-2 (SPL+Hi-2) | Weighted harmonic distortion (blat distortion) used for Application Note AN 7 |
DIS SPL, Harm protected | Harmonic distortion measurement with protection |
SIM closed box analysis | Maximal displacement, dc displacement, compression, SPL, distortion using large signal parameters imported from LSI BOX |
SIM Equiv. Input Harmonics | Equivalent input harmonic distortion using large signal parameters imported from LSI; Simulated results are comparable with TRF Equiv. Input Harm. (SPL). |
SIM vented box analysis | Maximal displacement, dc displacement, compression, SPL, harmonic distortion using large signal parameters imported from LSI BOX |
| TBM ANSI/CEA2010A | Maximum SPL measurement according to Standard ANSI/CEA-2010-A |
| TBM ANSI/CEA2010B | Maximum usable Sound Pressure Level - Peak measurement according to Standard ANSI/CEA-2010-B |
| TBM ANSI/CEA2034 | On-Axis Maximum Sound Pressure Level - Peak measurement according to Standard ANSI/CEA-2034 |
Application Notes
AN 4 Measurement of Peak Displacement Xmax (performance-based method)
AN 7 Measurement of Weighted Harmonic Distortion HI-2
AN 9 3D Harmonic Distortion Measurement
AN 20 Equivalent Harmonic Distortion
AN 24 Measuring Telecommunication Drivers
AN 33 EIA Distortion Test
AN 36 Characteristic Harmonic Distortion
AN 41 Measurement at defined terminal voltage
Standards
Audio Engineering Society
AES2 Recommended practice Specification of Loudspeaker Components Used in Professional Audio and Sound Reinforcement
International Electrotechnical Commission
IEC 60268-5 Sound System Equipment, Part 5: Loudspeakers
Consumer Electronics Association
CEA-2010 A Standard Method of Measurement for Powered Subwoofers
CEA-2010 B Standard Method of Measurement for Subwoofers
CEA-2034 Standard Method of Measurement for In-Home Loudspeakers
Other Related Tests
Rub & Buzz and impulsive distortion
DC displacement – dynamic offset the voice coil
Compression of fundamental components
Separated loudspeaker distortion
Multi-tone distortion
Intermodulation distortion
Air leakage noise
Auralization
Transducer nonlinearities (curve shape)
Single-valued nonlinear parameters
Typical Test Objects
Papers and Preprints
W. Klippel, Tutorial “Loudspeaker Nonlinearities - Causes, Parameters, Symptoms,” J. of Audio Eng. Soc. 54, No. 10, pp. 907-939 (2006 Oct.).
W. Klippel, “Equivalent Input Distortion,” J. of Audio Eng. Soc. 52, No. 9, pp. 931-947 (2004 Sept.).
S. F. Temme, “How to Graph Distortion Measurements,” presented at the 94th Convention of Audio Eng. Soc., 1993 March 16-19, Berlin, Preprint 3602.
W. Klippel, “Assessment of Voice-Coil Peak Displacement Xmax,” J. of Audio Eng. Soc. 51, Heft 5, pp. 307 - 323 (2003 May).
W. Klippel, U. Seidel, “Measurement of Impulsive Distortion, Rub and Buzz and other Disturbances,” presented at the 114th Convention of the Audio Eng. Soc., 2003 March 22–25, Amsterdam, The Netherlands, Preprint 5734.
W. Klippel, “Nonlinear Large-Signal Behavior of Electrodynamic Loudspeakers at Low Frequencies,” J. of Audio Eng. Soc., Volume 40, pp. 483-496 (1992).
A. Voishvillo, “Graphing, Interpretation, and Comparison of Results of Loudspeaker Nonlinear Distortion Measurements,” J. of Audio Eng. Soc., Volume 52, No. 4, pp. 332-357, April 2004.
W. Klippel, “Prediction of Speaker Performance at High Amplitudes,” presented at 111th Convention of the Audio Eng. Soc., 2001 September 21–24, New York, NY, USA.
David Clark, "Blat Distortion in Loudspeakers," DLC Design Note 950189.