Time-frequency Analysis
Characteristics: | KLIPPEL R&D System |
|---|---|
Time windowed impulse response | TRF, TFA |
Step response | TRF, TFA |
Energy time curve | TRF, TFA |
Group delay response | TRF, TFA |
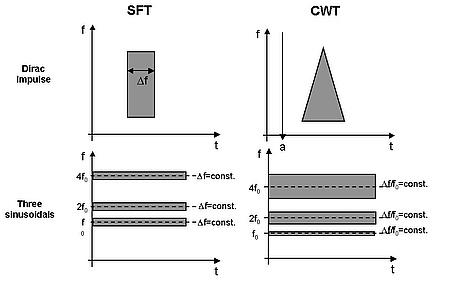
The impulse response in the time domain and the amplitude and phase response in the frequency domain are two alternative descriptions of a linear system which are directly coupled by the Fourier or Laplace transform. However, transforming only a windowed part of the impulse response into the frequency domain and repeating the transformation for shifted position of the window reveals the spectral properties of the impulse response versus time. The width and shape of the window determines the spectral and temporal resolution of the analysis. High spectral resolution (required for low frequency components) requires a long window while high temporal resolution (required for high frequency components) requires a short window length. The Wavelet transform (see figure below) for example uses an effective time window which becomes smaller at higher frequencies. The time-frequency analysis is important to identify resonances with a high quality factor (for example room modes) which cause a long ringing in the time domain but which are not visible in the total impulse response or in the steady-state frequency response.
KLIPPEL R&D SYSTEM (development)
Module | Comment |
|---|---|
| The post-processing capabilities of the TRF provide various methods of frequency-time analysis (cumulative decay, Wigner distribution and sonograph). | |
| Time Frequency Analysis (TFA) | TFA and visualization tool of measured signal and wave files using wavelet transform, filterbank and short term fourier transform. |
Templates of KLIPPEL products
Name of the Template | Application |
|---|---|
TRF cumulative decay | Cumulative spectral decay |
TRF SPL + waterfall | Sound pressure level and cumulative decay spectrum |
TRF sensitivity (Mic 2) | Calibration of the microphone at IN2 using a pistonphone |
TRF true acoustical phase | Total phase without time delay |
TRF SPL + harmonics | Standard measurement for fundamental component (SPL) and harmonic distortion |
Diagnost. MIDRANGE Sp1 | Comprehensive testing of midrange drivers with a resonance 30 Hz < fs < 200 Hz using standard current sensor 1 |
Diagnost. RUB&BUZZ Sp1 | Batch of Rub & Buzz tests with increased voltage (applied to high power devices) |
Diagnostics MICROSPEAKER Sp2 | Comprehensive testing of microspeakers with a resonance 100 Hz < fs < 2 kHz using sensitive current sensor 2 |
Diagnostics TWEETER (Sp2) | Comprehensive testing of tweeters with a resonance 100 Hz < fs < 2 kHz using sensitive current sensor 2 |
Diagnostics VENTED BOX SP1 | Comprehensive testing of vented box systems using standard current sensor 1 |
Diagnostics WOOFER (Sp1) | Comprehensive testing of subwoofers with a resonance 30 Hz < fs < 200 Hz using standard current sensor 1 |
Diagnostics WOOFER Sp1,2 | Comprehensive testing of subwoofers with a resonance 30 Hz < fs < 200 Hz using current sensor 1 and 2 |
IEC 20.6 Mean SPL | Mean sound pressure level in a stated frequency band according IEC 60268-5 chapter 20.6 |
IEC 21.2 Frequency Range | Effective frequency range according IEC 60268-5 chapter 21.2 |
IEC 22.4 Mean Efficiency | Mean efficiency in a frequency band according IEC 60268-5 chapter 22.4 |
Standards
Audio Engineering Society
AES2 Recommended practice Specification of Loudspeaker Components Used in Professional Audio and Sound Reinforcement
International Electrotechnical Commission
IEC 60268-5 Sound System Equipment, Part 5: Loudspeakers
Other Related Tests
Typical Test Objects
Papers and Preprints
D. Keele, “Time-Frequency Display of Electroacoustic Data Using Cycle-Octave Wavelet Transforms,” presented at the 99th Convention of Audio Eng. Soc. (October 1995), Paper No. 4136.
D. Newland, “Harmonic Wavelets in Vibration and Acoustics,” Phil. Trans. R. Soc. Lond. A (1999) 357, 2607 –625.
C. Janse, A. Kaizer, “Time-Frequency Distributions of Loudspeakers: The Application of the Wigner Distribution,” J. of Audio Eng. Soc., Volume 31, Issue 4, pp. 198-223, April 1983.
M. Poletti, “Linearly Swept Frequency Measurements, Time-Delay Spectrometry, and the Wigner Distribution,” J. of Audio Eng. Soc., Volume 36, Issue 6, pp. 457-468, June 1988.
M. Berman, L. Fincham, “The Application of Digital Techniques to the Measurement of Loudspeakers,” J. of Audio Eng. Soc., Volume 25, Issue 6, pp. 370-384, June 1977.

